







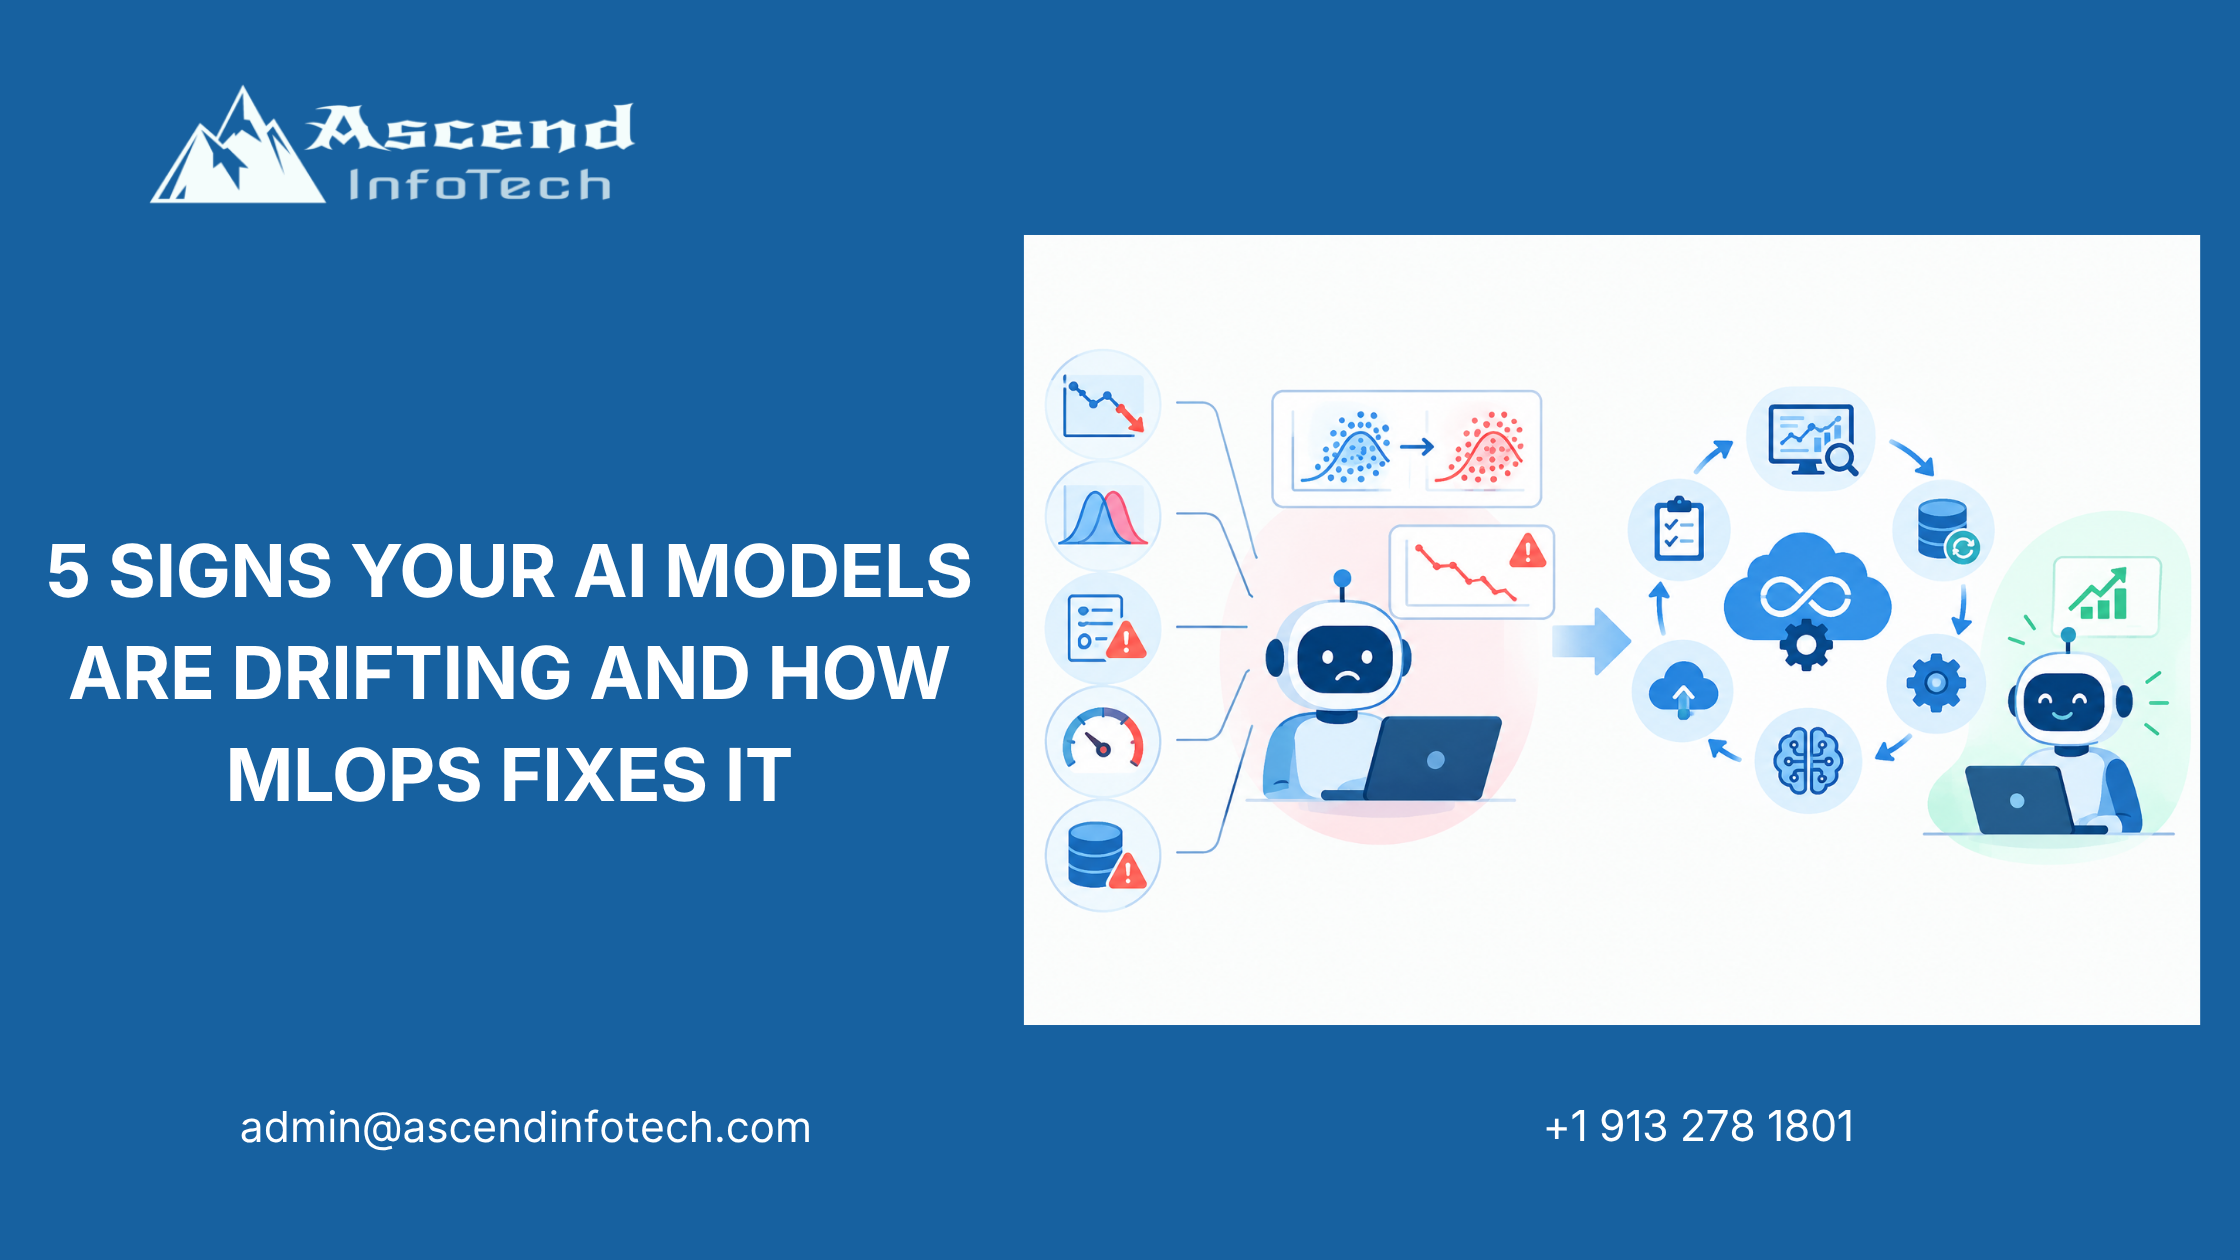
5 Signs Your AI Models Are Drifting and How MLOps Fixes It
A production AI model can keep returning predictions, pass infrastructure health checks and still become less useful over time. The code has not changed, the endpoint responds normally, yet accuracy, conversion or risk decisions begin to move in the wrong direction.
These are common AI model drift signs. They indicate that the relationship between the model and the world around it is changing. Drift may come from new customer behaviour, an upstream schema change, stale features, altered business rules or an external event.
MLOps helps data science teams detect these signals early, identify the cause and decide whether to repair the pipeline, recalibrate the model, retrain it or switch to a fallback process. MLflow describes effective drift monitoring as a combination of input checks, prediction analysis, business KPI tracking and automated responses tied to retraining workflows.
What Is Model Drift?
Model drift vs data drift
Model drift is a decline in a deployed model’s predictive performance even though its code, parameters or architecture remain unchanged.
Data drift is a change in the distribution of model inputs. It can be an early warning, but it does not always reduce performance.
Concept drift is a change in the relationship between inputs and the correct outcome. For example, the same customer behaviour may now indicate a different likelihood of churn because pricing, competition or customer expectations have changed.
| Type | What changes | What you need to confirm impact |
| Data drift | Distribution of input features | Production data compared with a baseline |
| Concept drift | Relationship between inputs and outcomes | Predictions compared with labelled outcomes |
| Prediction drift | Distribution of model outputs | Output monitoring over time |
| Training-serving skew | Feature calculation between training and production | Pipeline and feature consistency checks |
| Model drift | Predictive performance under current conditions | Business and model performance metrics |
A shift in input data should trigger an investigation, not an automatic retraining job. An upstream data problem can look like model drift but requires a pipeline fix instead.
5 AI Model Drift Signs
1. Accuracy and business performance decline
The clearest warning sign is a fall in model performance against a known baseline. Depending on the model, you may see:
- Lower accuracy.
- Falling precision or recall.
- Reduced F1 score.
- Lower AUC.
- Higher mean absolute error.
- More false positives or false negatives.
- Poorer calibration.
- Increased manual overrides.
Ground-truth labels may arrive days or months after a prediction. Once they become available, compare recent rolling-window performance with the approved baseline rather than relying on a lifetime average. Rolling windows make recent changes easier to see.
The business impact may appear before the data science dashboard changes. A recommendation model may show lower click-through rates. A fraud model may miss more suspicious transactions. A demand model may create excess stock or frequent shortages.
How MLOps responds
An MLOps monitoring layer should:
- Track model metrics over time.
- Compare them with warning and critical thresholds.
- Connect prediction records with later outcomes.
- Create an incident when performance crosses a threshold.
- Trigger investigation, retraining or rollback according to severity.
Do not treat one poor batch as proof of drift. Look for a sustained change or a statistically significant deviation that affects the business metric.
2. Input data no longer resembles the training data
A model may begin receiving customer, product, transaction or sensor data that differs from its training distribution. This is data drift.
Examples include:
- A fraud model receiving transactions from a new market.
- A retail model seeing a different age distribution after a campaign.
- A credit model receiving applications during an economic shift.
- A recommendation system handling a new product category.
- A healthcare model receiving data from a different patient population.
Data drift can happen gradually or suddenly. A new region may produce a slow population shift, while a source-system change can alter a field overnight.
How MLOps responds
Compare live feature distributions with a training baseline or a stable production reference. Useful methods include:
- Population Stability Index (PSI).
- Kolmogorov–Smirnov tests for continuous data.
- Chi-squared tests for categorical data.
- Jensen–Shannon distance.
- Summary-statistic checks.
- Embedding-distance monitoring for text or image systems.
MLflow reports a common PSI interpretation: values below 0.1 generally indicate stability, 0.1 to 0.25 warrant investigation and values above 0.25 signal significant drift requiring fast action.
A threshold is a starting point, not a universal rule. Set it according to the feature, business risk, data volume and expected seasonal variation.
3. Features become stale, sparse or inconsistent
A feature can remain present in a schema while becoming less useful in practice. This is one of the easiest AI model drift signs to miss.
Watch for:
- Rising null rates.
- Delayed feature arrival.
- Values outside expected ranges.
- A sudden drop in category frequency.
- Incorrect units.
- Changed date or time-zone logic.
- Duplicate records.
- Training-serving skew.
- Features that stop reflecting current behaviour.
A model may still produce a prediction even when a feature is empty or outdated. That makes the problem more dangerous than a clear service outage.
For example, a support-priority model may depend on recent customer activity. If the activity pipeline begins arriving 48 hours late, the model may classify urgent cases using old information. Infrastructure monitoring may show that the service is healthy while the decision quality declines.
How MLOps responds
Add data-quality checks before inference:
- Validate schema and data types.
- Monitor missing-value rates.
- Check freshness against service-level targets.
- Compare ranges with approved limits.
- Verify joins and unique identifiers.
- Record feature-generation versions.
- Stop or route to a fallback when critical features fail.
Training and serving should use the same feature definitions wherever possible. If a feature changes, the change should pass testing and approval before it reaches production.
4. Prediction patterns change unexpectedly
Prediction drift occurs when the distribution of model outputs changes, even before labelled outcomes are available.
Examples include:
- A fraud model’s positive-prediction rate rises from 12% to 28%.
- A credit model rejects far more applications than usual.
- A recommendation model assigns most users to the same product category.
- A customer-service classifier routes nearly every case to one queue.
- A forecasting model consistently predicts below actual demand.
Prediction drift does not prove that the model is wrong. The business environment may have changed legitimately. It is an early signal that something deserves review.
A sudden output shift may come from:
- New input populations.
- A broken feature.
- An upstream schema change.
- A threshold change.
- A new product or campaign.
- An external event.
- A change in user behaviour.
- A model-serving mismatch.
How MLOps responds
MLOps can store predictions and monitor their distribution by:
- Time period.
- Geography.
- Customer segment.
- Product category.
- Channel.
- Risk band.
- Model version.
Compare the current output distribution with the deployment baseline. Pair the output alert with feature and pipeline information to narrow the cause. Prediction monitoring is especially useful when actual labels are delayed.
5. Manual overrides and exceptions increase
A rise in human overrides is often an operational signal that users no longer trust the model. It may appear before formal accuracy metrics decline.
Monitor:
- Manual approvals after model rejection.
- Manual rejection after model approval.
- Cases routed out of the automated path.
- Repeated corrections by the same user group.
- Support complaints about recommendations.
- Review time per prediction.
- Fallback usage.
For example, an insurance claims model may continue to meet its overall accuracy target while claims staff override more decisions from a particular region. The average metric hides a local performance problem.
How MLOps responds
Connect human feedback to model records. Capture:
- Model version.
- Input snapshot.
- Prediction.
- Human decision.
- Reason for override.
- Final outcome.
- Relevant segment or business unit.
The data science team can then check whether the issue is segment-specific, caused by a new process or linked to a feature problem. Feedback can become labelled data for retraining, but only after review.
Business Consequences of Model Drift
Financial impact
A drifting model may produce incorrect pricing, poor forecasts, missed fraud or inefficient marketing decisions. The cost grows when predictions feed automated actions.
For example:
- A demand model creates excess inventory.
- A credit model approves unsuitable applications.
- A fraud model increases false declines.
- A recommendation model reduces conversion.
- A claims model delays legitimate payments.
The cost should be measured at the workflow level, not only through model accuracy.
Operational impact
Teams may respond to unreliable predictions by adding manual checks. This can create:
- Longer processing times.
- Larger review queues.
- More employee workload.
- Slower customer responses.
- Reduced trust in automation.
- Duplicate work between systems and people.
An automated process that requires constant correction may no longer be more efficient than the original manual process.
Compliance and model risk
In regulated settings, organisations may need evidence that models remain suitable for current data and operating conditions. Drift monitoring supports:
- Model inventories.
- Performance records.
- Approval histories.
- Data and feature lineage.
- Incident records.
- Retraining decisions.
- Human-review evidence.
The specific requirements depend on industry, jurisdiction and use case. A high-impact model should have documented thresholds and an accountable owner.
How MLOps Detects Drift Early
A layered monitoring approach
No single metric catches every problem. Use several layers:
- Data-quality checks
Look for null rates, type mismatches, range violations and freshness failures. - Input-distribution monitoring
Compare production features with the training or reference baseline. - Prediction monitoring
Track changes in output distributions when labels are delayed. - Performance monitoring
Compare predictions with actual outcomes when ground truth becomes available. - Business KPI monitoring
Connect model health with conversion, fraud capture, service time, loss rate or another outcome. - Infrastructure monitoring
Check latency, errors, availability, resource usage and pipeline status.
This layered design helps distinguish a model issue from a data pipeline or infrastructure issue.
Alert thresholds and response levels
| Alert level | Example condition | Typical response |
| Informational | Small seasonal change | Record and continue watching |
| Warning | Moderate feature or prediction shift | Investigate source, segment and recent changes |
| Critical | Sustained performance decline or major data failure | Route to fallback, pause automation or start incident response |
| Recovery | New model passes validation | Approve promotion and continue monitoring |
Thresholds should be set before deployment. If teams invent thresholds after an incident, they may overreact to normal variation or underreact to meaningful degradation.
MLOps Fixes for Model Drift
Repair the data pipeline
If drift is caused by a schema change, stale feed or broken transformation, fix the source rather than retraining the model.
Typical repairs include:
- Restoring a renamed field.
- Correcting a unit conversion.
- Repairing a failed join.
- Reversing an incorrect feature transformation.
- Reducing data latency.
- Adding validation at the source.
Retraining on broken data can hide the real problem and create a second defective model.
Recalibrate predictions
If ranking remains useful but confidence scores no longer match actual outcomes, recalibration may be enough. This is common in classification systems where probability estimates have shifted but ordering remains reliable.
Validate the recalibrated model on recent labelled data before promotion.
Retrain with current data
Retraining may be appropriate when:
- The production population has shifted.
- Recent labelled data is reliable.
- The task and feature definitions remain suitable.
- Performance has declined consistently.
- A new model passes all validation gates.
Use a recent data window when the domain changes quickly, but retain enough historical data to avoid overfitting to a temporary event.
Replace or redesign the model
A new model may be necessary when:
- The target relationship has fundamentally changed.
- Important features no longer represent the business.
- The model cannot handle new categories or populations.
- Retraining does not restore performance.
- The business process has changed substantially.
A replacement should be treated as a new release with documented testing, approval and rollback.
Use a fallback path
High-risk systems should have a fallback before drift occurs. Options include:
- A previous model version.
- A simpler rule-based model.
- Manual review.
- A conservative approval threshold.
- Temporary suspension of automated decisions.
The fallback should be tested regularly. A backup that has never been exercised may fail during a real incident.
A Practical Drift-Response Workflow
When an alert fires, follow a repeatable sequence:
- Confirm that the metric or distribution shift is real.
- Identify which model version and segment are affected.
- Check recent data-pipeline, schema and deployment changes.
- Separate seasonal variation from sustained drift.
- Review business KPIs and human overrides.
- Decide whether the cause is data, concept, feature or infrastructure related.
- Apply the least disruptive fix.
- Validate the fix on recent data.
- Promote, roll back or route to fallback.
- Record the incident and update monitoring rules.
This workflow prevents the common mistake of retraining every time a drift metric crosses a threshold.
Conclusion:
AI model drift rarely begins with a dramatic outage. It usually appears as a gradual change in accuracy, inputs, features, predictions or human behaviour. MLOps gives data science leaders the monitoring, ownership and response process needed to catch those changes early and keep production AI aligned with the business.
Frequently Asked Questions
1. What are the main AI model drift signs?
The main signs include declining accuracy or business performance, changing input distributions, stale or sparse features, unexpected prediction patterns and a rise in manual overrides or exceptions.
2. Does data drift always mean that a model is failing?
No. Data drift indicates that production inputs differ from the training or reference data. Model performance may remain stable if the change does not affect the patterns the model relies on.
3. How can I detect drift when labels are delayed?
Monitor input distributions, prediction distributions, data quality and business KPIs. Once actual outcomes become available, compare recent performance with the approved baseline.mlflow+1
4. What is the difference between data drift and concept drift?
Data drift changes the distribution of inputs. Concept drift changes the relationship between inputs and outcomes. Data drift can be detected without labels, while confirming concept drift usually requires actual outcomes.
5. Should drift automatically trigger retraining?
Not always. First check whether the cause is a pipeline failure, schema change, seasonal shift or genuine concept change. Retrain only after the data and cause have been validated.
6. Which metrics help detect model drift?
Common metrics include PSI, KS tests, chi-squared tests, Jensen–Shannon distance, accuracy, precision, recall, F1, AUC, mean absolute error and prediction-rate changes. Use metrics that match the data type, model and business risk.
7. How does MLOps help with model drift?
MLOps connects data checks, drift monitoring, model performance tracking, incident response, retraining, validation and deployment. It turns drift management into a repeatable lifecycle rather than a manual reaction.